Figure 2.

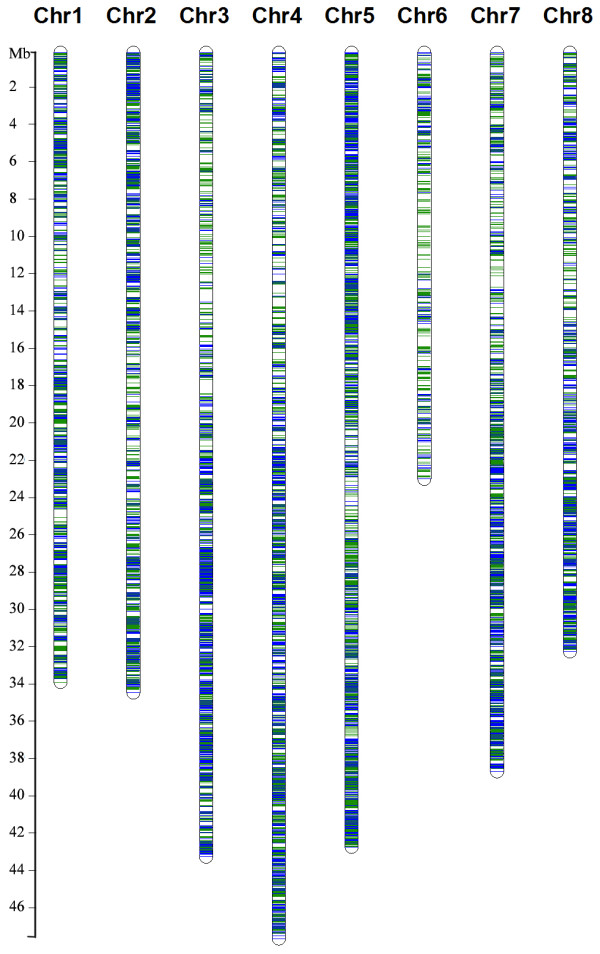
Alfalfa sequences mapped to MT 3.5 pseudomolecules with a threshold of 95% identity and 90% coverage. Blue lines represent alfalfa sequences without candidate SNPs and green lines represent alfalfa sequences containing candidate SNPs.

Alfalfa sequences mapped to MT 3.5 pseudomolecules with a threshold of 95% identity and 90% coverage. Blue lines represent alfalfa sequences without candidate SNPs and green lines represent alfalfa sequences containing candidate SNPs.