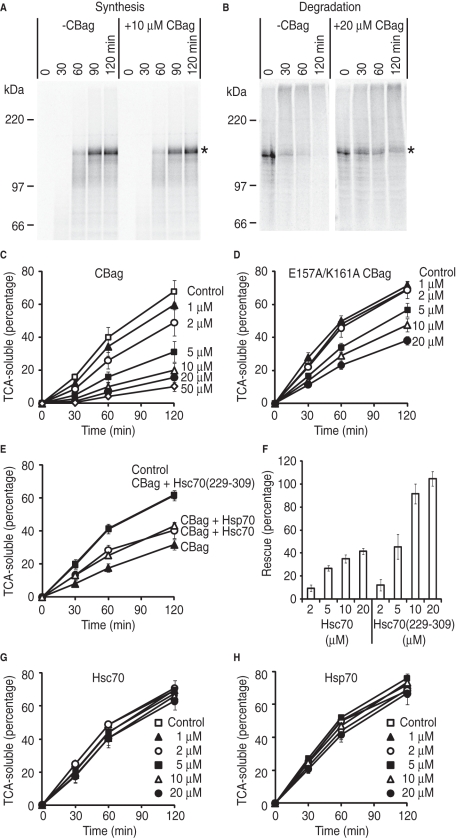
FIGURE 3:
Destabilization of Hsc70 binding by CBag blocks CFTR degradation. (A) Phosphorimage of CFTR translation reaction performed in the presence or absence of 10 μM CBag. Asterisk shows full-length CFTR. (B) CFTR was synthesized in the absence of CBag and subjected to in vitro degradation in the presence (right) or absence (left) of 20 μM CBag. Asterisk shows full-length CFTR. (C) CFTR was synthesized in the absence of CBag and subjected to in vitro degradation in the presence and absence (control) of indicated CBag concentrations. The y-axis represents the percentage of initial CFTR protein that is converted into TCA-soluble fragments. Data show mean ± SEM (n = 3–7). (D) In vitro degradation assay was carried out as in (C), but with the E157A/K161A mutant CBag. (E) CFTR degradation was carried out in the presence and absence (control) of 5 μM CBag and 20 μM Hsc70, Hsp70, or Hsc70(229–309) as indicated. (F) CFTR degradation was carried out as in (E) but with indicated concentration of Hsc70 or Hsc70(229-309). The y-axis shows the percentage of rescue of CFTR degradation due to CBag inhibition that was restored by addition of Hsc70 or Hsc70(229-309) as described in Materials and Methods. Data show mean ± SEM (n = 3–6). (G) In vitro degradation assay was carried out in the presence and absence (control) of indicated Hsc70 concentrations. (H) In vitro degradation assay was carried out in the presence and absence (control) of indicated Hsp70 concentrations.

