Figure 3:
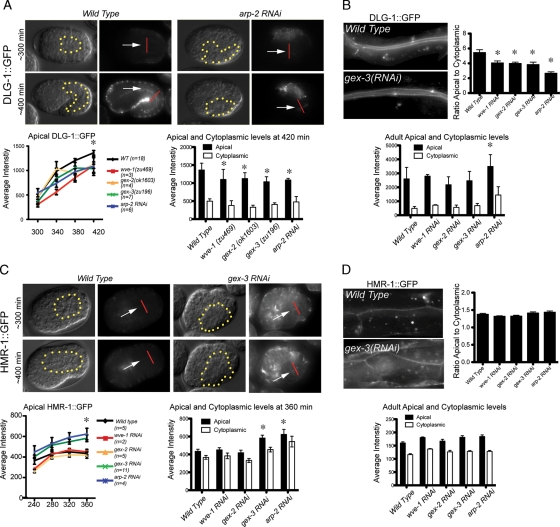
Arp2/3 regulates some apical junction components in embryos and adults. (A) Live imaging of DLG-1::GFP during intestinal morphogenesis. The same embryo is shown via DIC optics (left) and fluorescence (right). The levels of DLG-1::GFP were recorded in equally staged wild-type and mutant embryos every 40 min beginning at midembryogenesis. The dotted yellow line indicates the outline of the intestine. White arrows point to the developing apical intestine. The additional signal around the periphery of the embryos is from the DLG-1::GFP expression in the epidermis. The apical intestinal signal was calculated by placing a line (shown in red) across the intestine, and the maximum reading generated using the Line Function of ImageJ was recorded as the apical signal. The cytoplasmic signal was calculated as the average of the signal at the center of the two intestinal cells 2.5 μm on either side of the apical intestine. The graph on the left summarizes the average apical DLG-1::GFP levels in wild-type and Gex embryos; x-axis numbers indicate minutes after first cleavage. The graph on the right shows the average apical and cytoplasmic DLG-1::GFP levels in wild-type and Gex embryos at 420 min after first cleavage. (C) Live imaging of HMR-1::GFP during embryonic intestinal morphogenesis. Labeling, measurements, and graphs were done as in A, except the graph on the right shows the apical and cytoplasmic levels at 360 min after first cleavage. (B, D) DLG-1::GFP and HMR-1::GFP accumulation in adults. Top, the ratio of apical to cytoplasmic. Bottom, apical and cytoplasmic levels of DLG-1::GFP (B) and HMR-1::GFP (D) in the intestines of young adult worms were measured as described for the embryonic intestines. Micrographs show similarly staged worms expressing DLG-1::RFP and HMR-1::GFP. For each genotype n > 10 adult worms. Error bars show SEM. Asterisks indicate statistical significance, p < 0.05.

