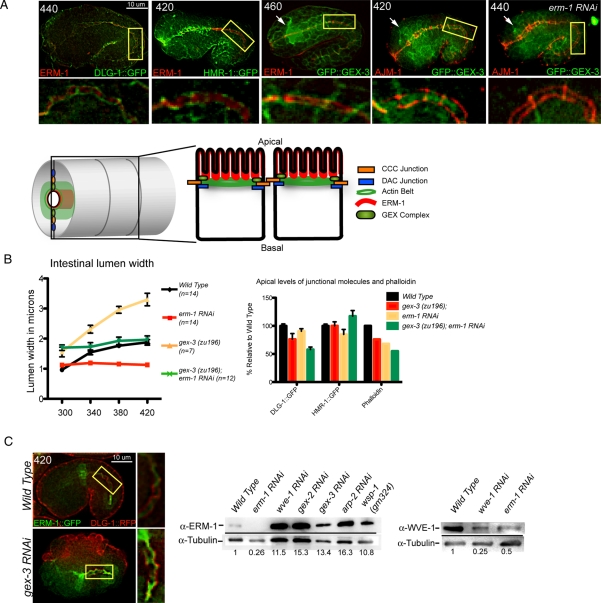
Figure 5:
The WAVE/SCAR complex regulates intestinal morphogenesis through ERM-1. (A) Localization of WAVE proteins relative to ERM-1 and the apical junction. Fixed embryos doubly labeled with antibodies to ERM-1 (Hadwiger et al., 2010), AJM-1 (MH27) (Francis and Waterston, 1991; Koppen et al., 2001), and GFP (ab6556, Abcam) to visualize DLG-1::GFP (Totong et al., 2007) and a GFP::GEX-3–rescuing transgene (Soto et al., 2002). Age of embryos in minutes after first cleavage is indicated at upper left. All embryos are in a wild-type genetic background, except for the embryo at the right, which was depleted of ERM-1 via RNAi. White arrows point to the developing nerve ring, which in wild-type embryos has high GFP::GEX-3 expression. Image contrast was enhanced equally to better illustrate the subcellular localization. Section of the intestine in the yellow rectangle is amplified below the micrograph. The bright spot on the upper right corner of the rightmost embryo is nonspecific signal, visible in all channels. The model shows the location of ERM-1 (red) relative to WAVE/SCAR (light green) and the DAC junction (blue). (B) Comparison of the effects of WAVE and/or ERM-1 loss on apical intestine development. Left, embryos carrying the dlg-1::gfp transgene were used to monitor the width of the intestinal lumen over time in wild-type, erm-1(RNAi), gex-3(zu196), and gex-3(zu196);erm-1 (RNAi) strains. Right, comparison of changes in the apical DLG-1::GFP, HMR-1::GFP, and phalloidin levels in erm-1(RNAi), gex-3(zu196), and gex-3(zu196);erm-1 (RNAi) strains. Measurements of apical DLG-1::GFP and HMR-1::GFP were taken as described in Figure 3. Phalloidin data are from Figure 4. (C) WAVE and ERM-1 effects on each other's protein levels. Live embryos carrying two transgenes, DLG-1::RFP and ERM-1::GFP, imaged with wild type and reduced (gex-3 RNAi) WAVE complex. Magnified image of the intestine in the merged image is shown to the right. Image contrast was enhanced equally to better illustrate the localization, but quantitation was performed on raw images. Western blot analysis of ERM-1 levels in lysates depleted of branched actin regulators (middle) and of WVE-1 levels in lysates depleted of ERM-1 (right). Numbers below the blots show fold increase over wild type as normalized to tubulin and represent the average of two independent sets of lysates and three blots (ERM-1 Western) and three independent sets of lysates and seven blots (WVE-1 Western). Error bars show SEM. Asterisks mark statistical significance, p < 0.05.

