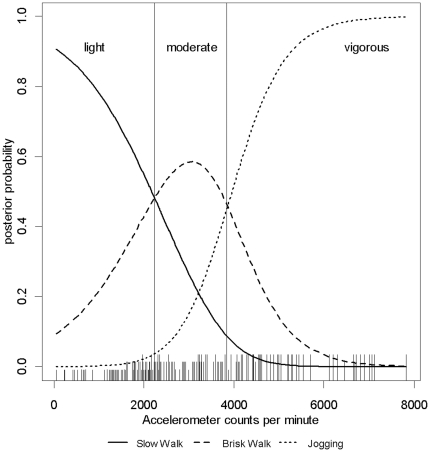
Figure 2. Posterior probability vectors for light, moderate and vigorous activity.
Posterior probability vectors for light, moderate and vigorous activity and the cut points which occur at the points of intersection. Activities corresponding to the observed counts are indicated by the height of the ticks on the x-axis: the shortest ticks represent slow walking and the tallest represent jogging.

