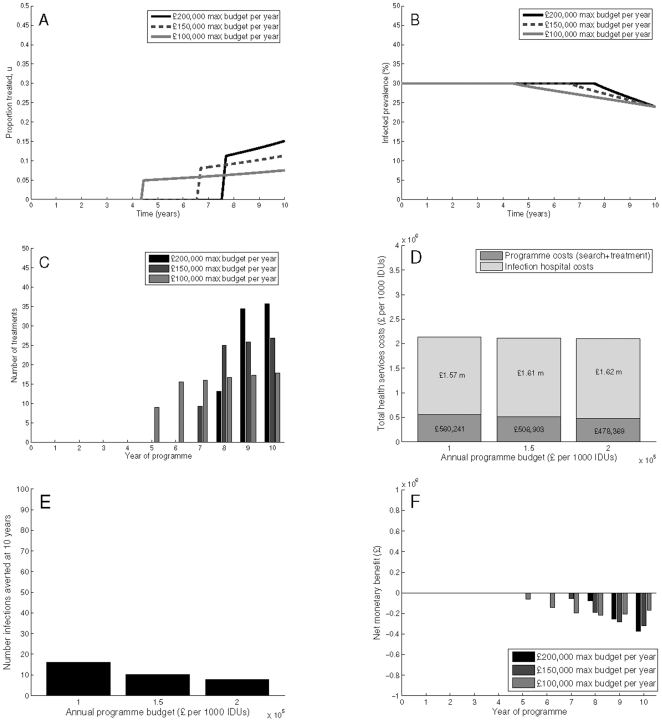
Figure 3. Scenario C: Minimising only health service costs with a final time prevalence target.
Simulations are with a 30% baseline prevalence, showing (A) programme coverage, (B) prevalence reductions, (C) number of treatments, (D) total health service costs (comprised of programme costs and infection costs), (E) infections averted, and (F) net monetary benefit. Here, we neglect health utility losses. Parameters used are as shown in Tables 1–2, with  ,
,  , and a final time prevalence target constraint.

