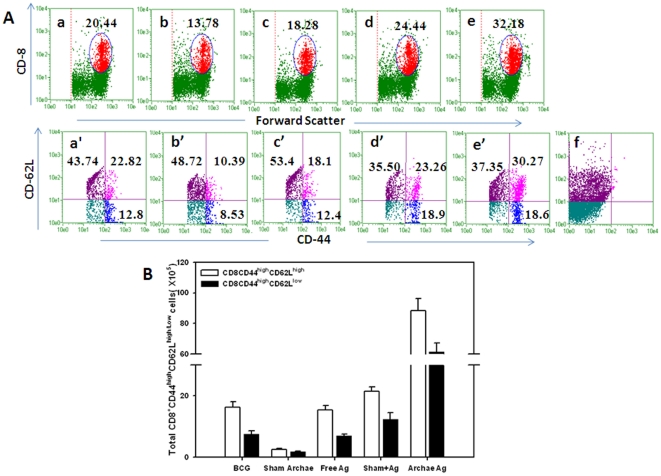
Figure 5. Expansion of the long-term CD8+ T cell effector and central memory response after immunization with various forms of Rv3619c on 8 weeks post challenge with M. tb Lymphocytes isolated from spleens of animals belonging to various immunized groups were stained for expression of CD44, CD62L, on CD8+ T cells and analyzed by flow cytometry.
(A) The dot plot graphs in upper panel representing BCG (a), Sham (antigen free) archaeosome as control (b), Free Rv3619c Ag (c), Sham archaeosome + free Rv3619c, a physical mixture (d), Archaeosome entrapped Rv3619c Ag (e), and isotype control (f). The lower panel indicates the population of CD44 and CD62Llow/high on gated CD8+ T cells of corresponding upper panel. Bars indicate the total number of CD8+ T cells expressing CD44highCD62Llow/high (B), The data were analyzed with the Student's t test and are shown as the means (±S.D.) of 2 independent experiments. Archaeosome encapsulated Rv3619c Vs BCG p<0.001 CD8+ (CD44high, CD62Llow and CD62Lhigh); physical mixture of sham archaeosome and free antigen Vs BCG p<0.05 (CD8+CD44high, CD8+CD62Llow), p = NS (CD8+CD62Lhigh); archaeosome encapsulated Rv3619c Vs free Rv3619c Ag p<0.001 CD8+ (CD44high, CD62Llow and CD62Lhigh).

