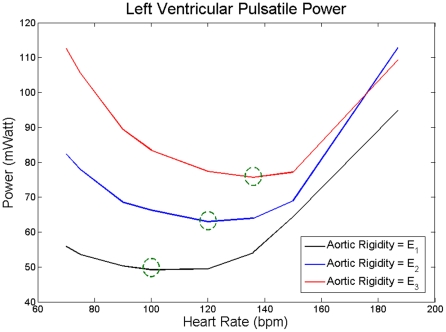
Figure 6. Average value per cycle of pulsatile power  versus HR for three different levels of aortic rigidities.
E1 (black) corresponds to the values given in Table 1, E2 = 1.25E1 (blue), and E3 = 1.5E1 (red). Green circles are the heart rates corresponding to the minimum  value at each level of aortic rigidity.

