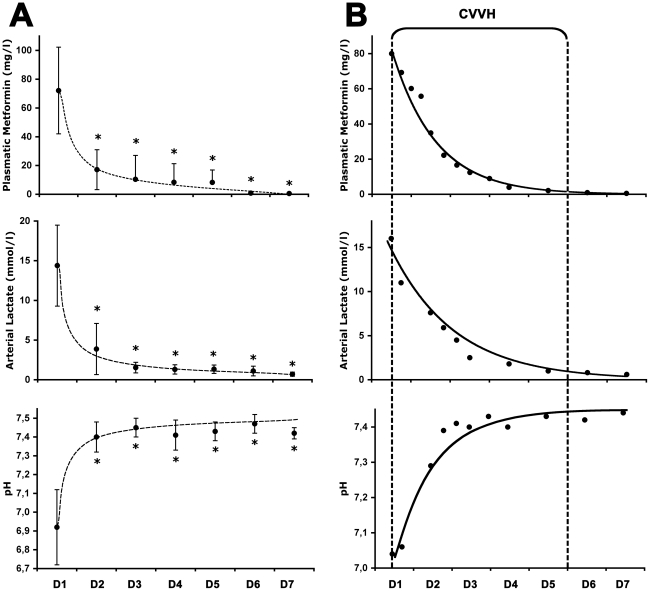
Figure 1. Acidosis, lactate and metformin levels under continuous renal replacement therapy.
Panel A: Data from all patients, expressed as mean ± SD, showing that metabolic acidosis, as well as the excessive dose of metformin observed at admission (day 1, D1), were dramatically reduced from day 2 (D2). * p<0.01 versus D1. Panel B: Typical evolution in case patient 1 of both metformin plasma concentrations and metabolic disorders, which were controlled within 2 days of initiating continuous venovenous hemofiltration (CVVH), i.e. without dialysate.

