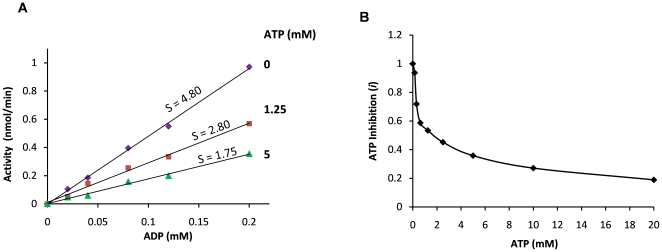
Figure 4. ATP inhibition of CD39L2-catalyzed ADP hydrolysis.
A) Rate constants for CD39L2 in the presence of different concentrations of ATP. The reactions were performed with 0.12 µg of CD39L2 in 50 µL of the kinase assay buffer at room temperature. For clarity, only data at 0, 1.25 and 5 mM of ATP are shown. Slopes (s) of the curves represent the rate constants. Elevated phosphate levels in all reactions due to ATP hydrolysis were regarded as background and were subtracted out. B) ATP inhibition factor (i), the ratio of a rate constant in the presence of ATP to the rate constant in the absence of ATP, is plotted versus ATP concentration.

