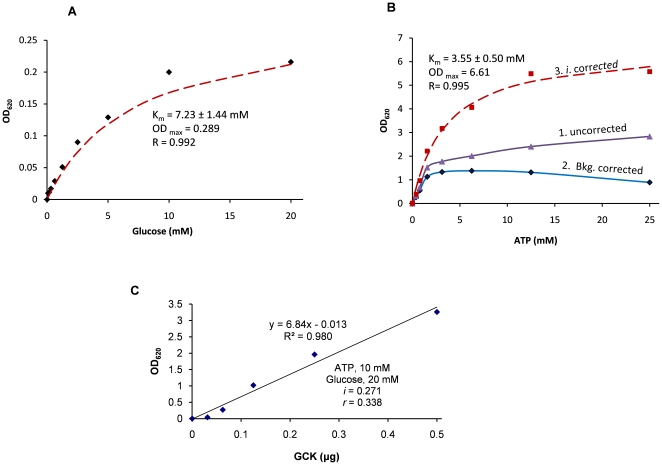
Figure 5. Assay for recombinant human GCK.
A) A Glucose curve. All reactions were initiated in the presence of 0.12 mM ATP, 0.2 µg GCK and 0.3 µg CD39L2 in 150 µL assay buffer at room temperature and proceeded for 15 minutes. The reaction that contained no glucose was set as a blank and the OD readings were plotted versus glucose concentration. The curve fit the Michaelis-Menten equation well with Km of 7.23±1.44 mM. B) An ATP curve. Reactions were performed in the presence of 20 mM glucose, 1 µg GCK and 0.1 µg CD39L2 and variable concentrations of ATP in 50 µL assay buffer at room temperature and proceeded for 25 minutes. The reaction that contained no ATP was set as a blank. For each ATP concentration, a no-kinase negative control was performed for background correction. The OD readings of the reactions (purple) were first corrected with backgrounds subtraction (blue) and further corrected using ATP inhibition factors (red) and finally fit with the Michaelis-Menten equation to obtain a Km around 3.55 mM. C) A GCK dose curve was performed with 10 mM ATP, 20 mM of glucose and 0.2 µg CD39L2 in 50 µL assay buffer at room temperature. All reactions were proceeded for 20 minutes and the OD was plotted versus GCK input. The reaction that contained no kinase was set as a blank. The slope of the curve, 6.84 OD/µg, corresponded to a specific activity of 2416 pmol/min/µg using Eq.10 (k2 = 8.2 nmol·min−1·mM−1 ; Vol = 50 µL; t = 25 min; i = 0.271; r = 0.396).

