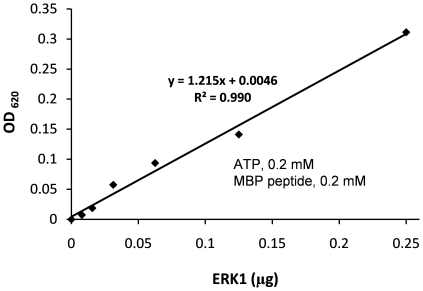
Figure 7. An enzyme curve for human extracellular signal-regulated kinase 1 (ERK1).
All reactions were initiated with 0.2 mM of ATP, 0.2 mM of myelin basic protein peptide and 0.2 µg of CD39L2 in 50 µL assay buffer and proceeded for 15 minutes. The OD was plotted versus ERK1 input. A reaction containing all components except kinase served as a blank. The slope of the curve (1.215 OD/µg) was converted to a specific activity, 482 pmol/min/µg, using Eq.10 and r = 0.597.

