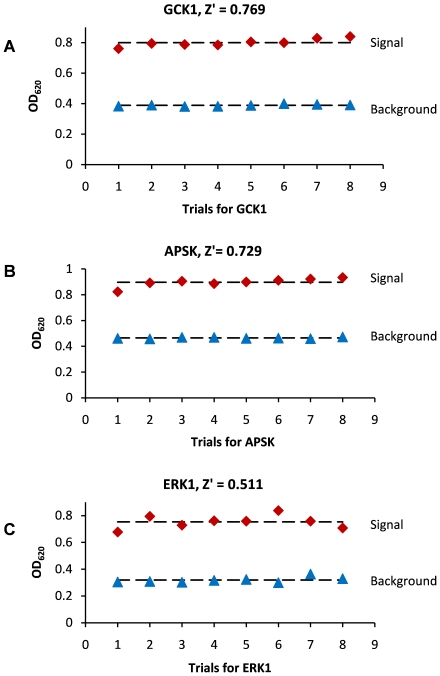
Figure 8. Z′ factor determination for the three representative kinases. Red diamonds represent the signal.
Blue triangles represent the background. Background reactions contained all components except the kinases. A) Trials for GCK. Reactions were performed with 20 mM Glucose, 0.1 mM ATP, 0.64 µg GCK and 0.1 µg CD39L2 in 150 µL kinase assay buffer at room temperature for 20 minutes. B) Trials for APSK. Reactions were performed with 0.0625 mM APS, 0.125 mM ATP, 1 µg APSK, 0.15 µg CD39L2 in 150 µL assay buffer at room temperature for 15 minutes. C) Trials for ERK1. Reactions were performed with 0.05 mM MBP, 0.1 mM ATP, 0.2 µg ERK1, 0.1 µg CD39L2 in 150 µL assay buffer at room temperature for 20 minutes.

