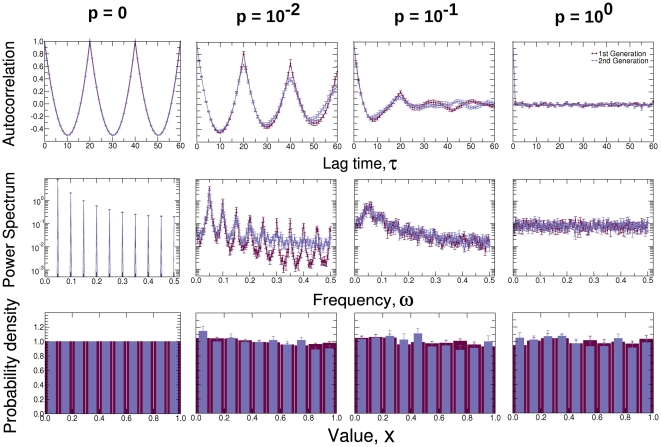
Figure 3. Comparison of statistical properties of first generation and second generation time series.
We compare the means of these properties over 10 different realizations of first and second generation time series. Error bars denote standard deviation across realizations. For both the first and second generation time series, the autocorrelation function and the power spectrum reveal a distinct signal when the time series are periodic ( ), which disappears when the time series become random (
 ). As expected from the toy model that has no biases toward particular values, both the first and second generation time series have values that are uniformly distributed between
  and
and  for all values of
  .
.

