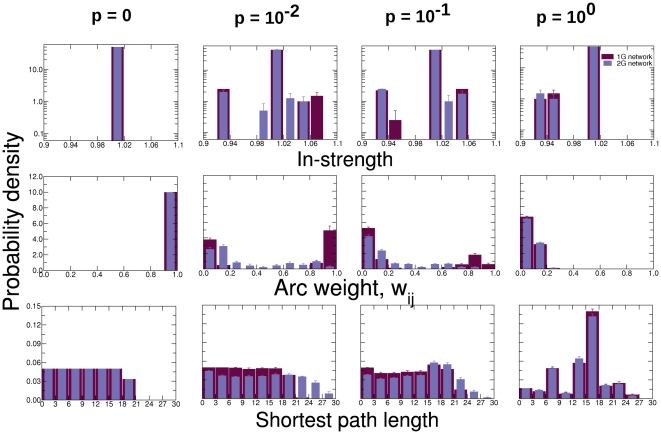
Figure 4. Comparison of topological properties of first generation and second generation networks.
We compare the means of these properties over 10 different realizations of first and second generation networks. Error bars denote standard deviation across realizations. In-strength is unitary for every node when the first and second generation networks are regular ( ) and, as the networks become increasingly random (left to right), the in-strength distribution broadens due to the redistribution of the weights. Note that the out-strength of a node is unitary in all cases, since the weights are Markovian probabilities. Arc weights are unitary for every arc when the first and second generation networks are regular (
 ). As
). As  increases, the arc weight distribution of the first and second generation networks shows presence of small weights (
 ) as well as large weights (
 ). The shortest path length are calculated as the minimum sum of inverted weights on a path from one node to another. Shortest path lengths [25] are uniformly distributed when the first and second generation networks are regular (
 ). As
). As  increases, random shortcuts generally decrease the distance between nodes, although for some cases, larger path lengths also arise due to redistribution of weights on the shortest path to other nodes. As the networks become more random (left to right), the shortest path distribution becomes increasingly peaked.

