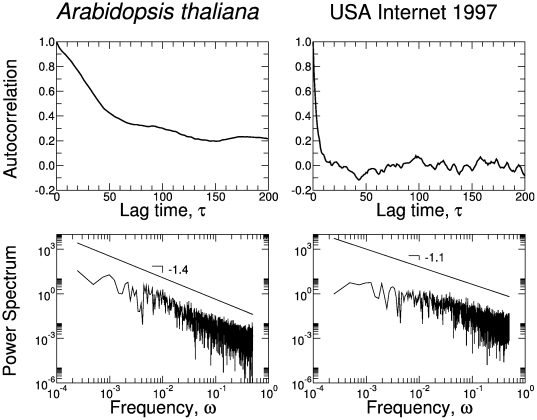
Figure 11. Statistical properties of the time series presented in Figure 9 , generated from the Arabidopsis thaliana network and the USA Internet 1997.
Note that the long-range correlations present in the metabolic network are well captured by the autocorrelation function and the corresponding power density spectrum, which displays a clear power-law scaling. On the other hand, the results in the USA Internet 1997 bear the footprint of the short-correlated signal generated by the Internet network. Note a power-law scaling with a less steep slope.

