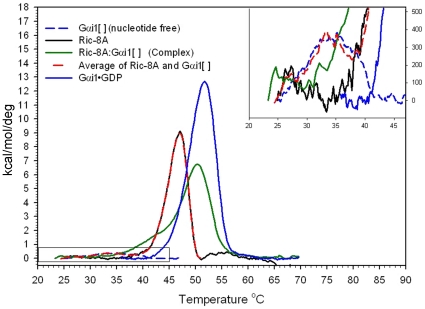
Figure 7. Thermal denaturation properties of Gαi1 and Ric-8A are affected by their mutual interaction.
Temperature-dependence of heat capacity was measured by differential scanning calorimetry. Buffer baseline-corrected thermograms were recorded for Ric-8A (black trace), Gαi1[ ] (dashed blue trace), Gαi1•GDP (blue trace) and Ric-8A:Gαi1[ ] (green trace). The weighted average of the thermograms for Ric-8A and Gαi1[ ] (red dashed line) overlaps that of Gαi1[ ] in the temperature range below ∼37°C and that of Ric-8A above that temperature, and is distinct from the thermogram of Ric-8A:Gαi1[ ]. The inset shows a magnified view of the four thermograms and the weighted average function in the 20°C–45°C range.

