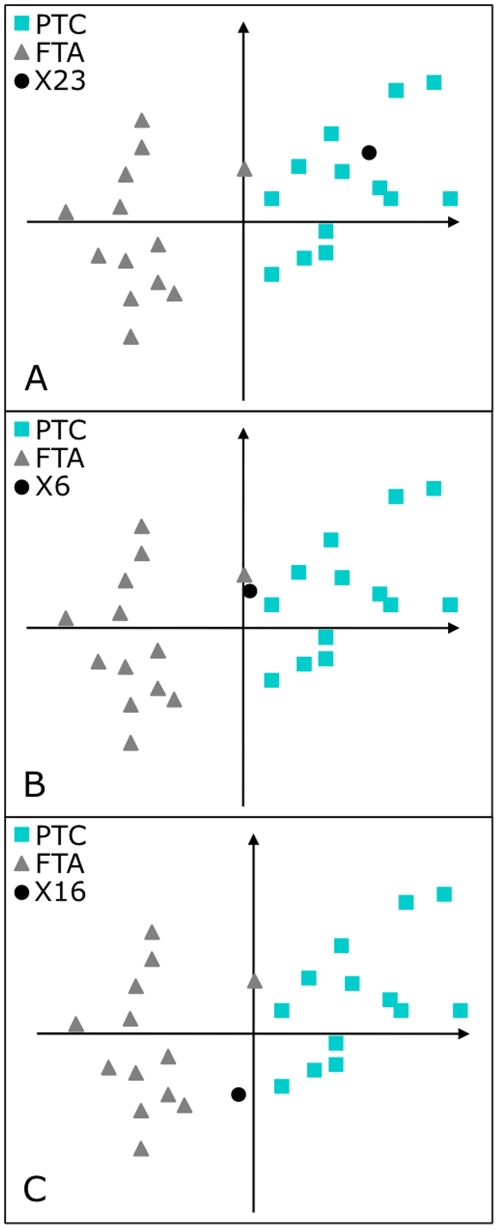
Figure 1. Two-step PCA positioning of the testing tumors: follicular thyroid adenoma and papillary thyroid carcinoma.
Examples of positioning of tumors ×23, ×6 and ×16 (dot) in the validation space. The FTA (triangle) populated area and the distinct PTC (square) populated area delimited the spatial distribution of the learning tumors in the validation space (Material and Methods 4.3.1b). A: one example of a correctly classified tumor (×23). B, C: outlier tumors (×6, ×16) positioned in the validation space between the two subgroups.

