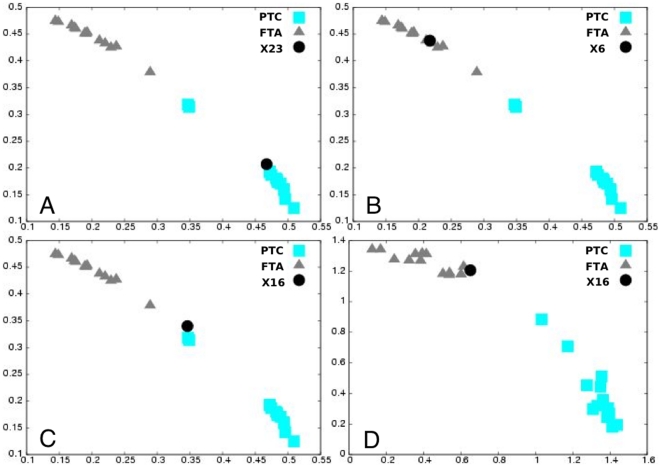
Figure 2. RMS classification of the testing tumors: follicular thyroid adenoma and papillary thyroid carcinoma.
Testing tumor (×23, ×6 and ×16) (dot) classification considering all eigenvectors (validation space) in the RMS computation (A, B and C), or considering the combination of eigenvectors that maximized the asymmetry between the two groups and minimized the heterogeneity within each subgroup together (new validation space) (D). Scatter plot of RMSFTA matrix as a function of the RMSPTC matrix for the learning tumors and the RMSFTA class as a function of the RMSPTC class of the considered testing tumor. The RMS values of the training tumors fall into two distinct groups (FTA, triangle and PTC, square). A: good classification of the ×23 tumor. B: good classification of the ×6 tumor without considering RMS (Figure 1B). C: outlier classification of the ×16 tumor in the validation space but D: good classification of the ×16 tumor considering the new validation space.

