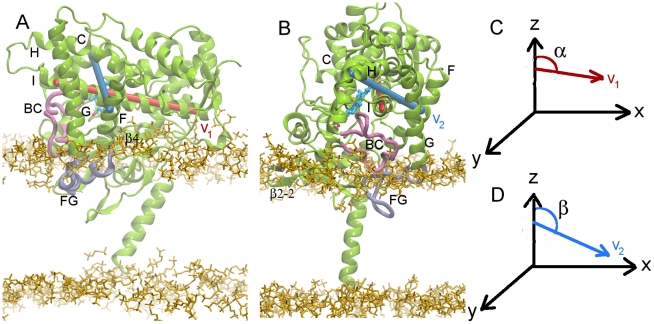
Figure 2. Models of membrane-bound CYP2C9.
(A) The 1R9OH1 model with the F' and G' helices in the FG loop. (B) The 1R9OH2 model with the FG loop unstructured. In order to define the orientation of the protein in the membrane, the complex was positioned with the membrane in the xy plane and vectors v1 and v2 were defined as follows: v1 (red): along the I helix, connecting the centers of the first and last helical turns in helix I defined by the midpoints of the Cα atoms of residues 285–289 and 312–316 respectively, and v2 (blue), orthogonal to v1, connecting one helical turn in helix C and one in helix F, i.e. the midpoints of the Cα atoms of residues 127–131 and 197–201, respectively. The orientation of CYP2C9 in the membrane was defined by the angles α (C) and β (D) between v1 and v2 and the z axis. The protein is shown in green cartoon representation with the FG and BC loops highlighted in cyan and mauve respectively. The heme is shown in a stick representation colored by atom type. The secondary structure is labeled as follows: helices with letters, strands with numbers, and loops with the labels of the 2 adjacent helices or sheets. The lipid head groups are shown in yellow. These protein and lipid representations are used throughout this manuscript.

