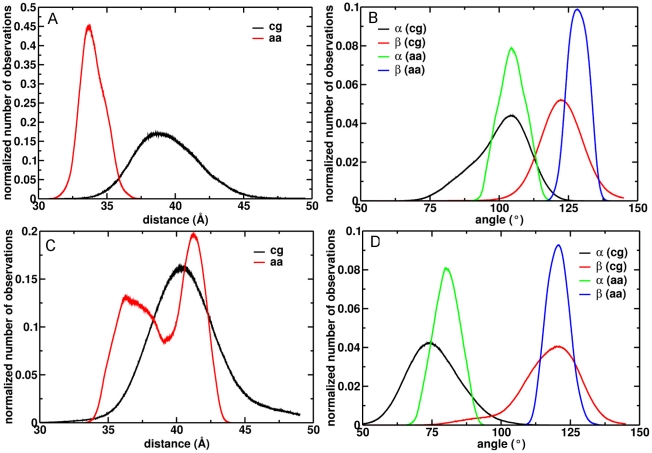
Figure 3. Predominant orientations of CYP2C9 in the membrane.
The projection of the distance between the protein and membrane centers of mass on the z axis is shown for the 1R9OH1 (A) and 1R9OH2 (C) models during the coarse grained (black) and atomic-resolution simulations (red). The angles α and β that define the protein orientation in the membrane (Fig. 2) are shown for the 1R9OH1 (B) and 1R9OH2 (D) models during the coarse grained (black and red) and atomic-resolution (green and blue) simulations.

