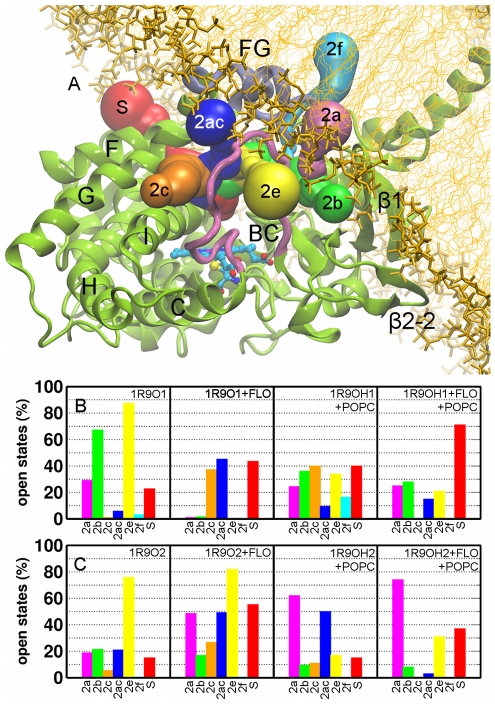
Figure 5. Tunnels from the CYP2C9 buried active site to the protein surface.
(A) Cartoon representation of all tunnels that were observed to open during the atomic-resolution simulations, labeled according to the nomenclature of Cojocaru et al. [20]. The percentage of trajectory frames in which different channels were open (the smallest radius along the tunnel >1.2 Å) is shown for the models 1R9O1, 1R9OH1 (B), and 1R9O2, 1R9OH2 (C). The colors of the bars correspond to the colors assigned to each tunnel in (A).

