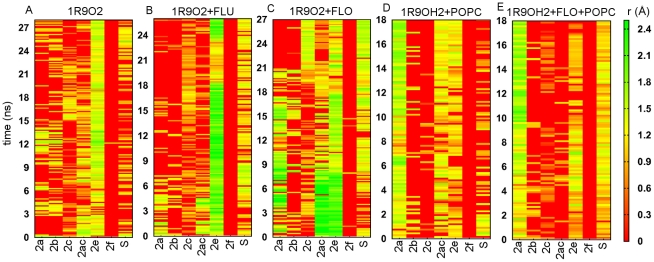
Figure 6. Correlation between the opening and closing of different tunnels during the simulations.
The smallest radius along each tunnel is plotted during the atomic-resolution simulations of membrane-bound (1R9OH2) and soluble (1R9O2) CYP2C9. (A) The apo form of 1R9O2. (B) 1R9O2 with bound substrate (flurbiprofen (FLU)). (C) 1R9O2 with bound product (4-hydroxy-flurbiprofen (FLO)). (D) The apo form of 1R9OH2. (E) 1R9OH2 with bound product (FLO). The color map ranges from closed (red to dark yellow) to open tunnels (light yellow to green).

