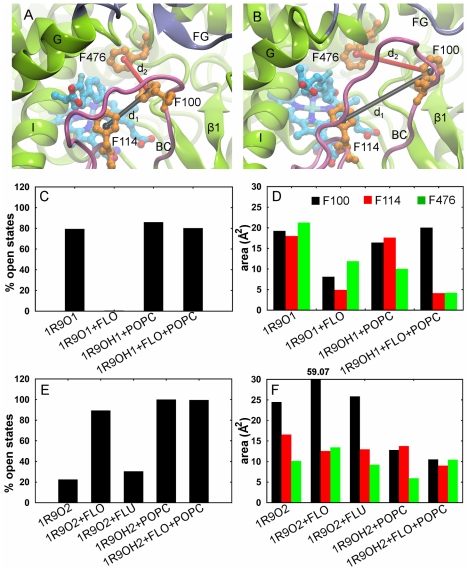
Figure 7. Conformational states of the internal aromatic gate formed by F100, F114 and F476.
(A) Closed. (B) Open. The distances between the centers of the phenyl rings (d1: F100–F114 (black), d2: F100–F476 (red)) define the conformational state of the gate. The gate was considered open if d2>7 Å while d1 was used to define the position of F100 with respect to the other phenylalanines. (C, E) The percentages of trajectory frames in which the gate is open in the atomic-resolution simulations of models 1R9O1, 1R9OH1 (C) and 1R9O2, 1R9OH2 (E). (D, F) The area covered by the centers of the phenyl rings projected on the heme plane (see Fig. S10 for details) in the atomic-resolution simulations of models 1R9O1, 1R9OH1 (D) and 1R9O2, 1R9OH2 (F).

