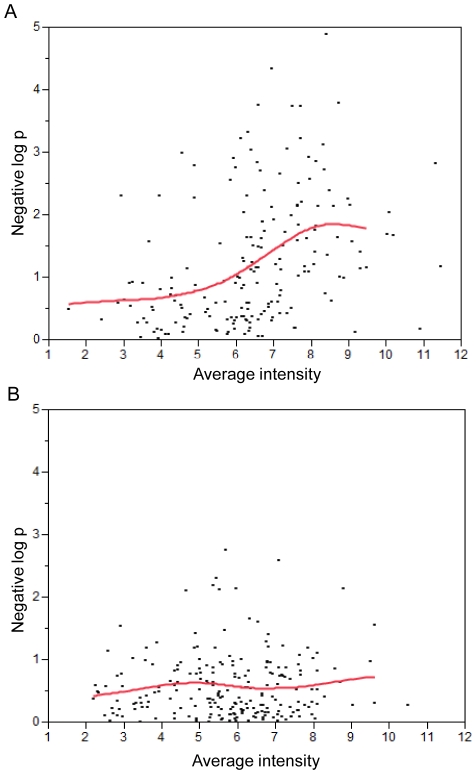
Figure 3. Expression patterns of genes located within and outside the amplified regions.
The negative log10 p values derived from t-tests were plotted against the average intensity levels for (A) genes located within and (B) outside the amplified regions. The spline curves were fit to extract the main trend of the data.

