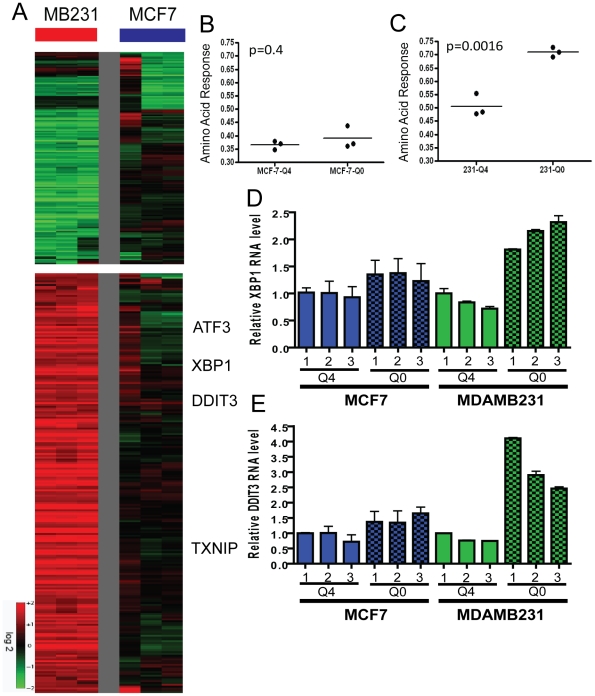
Figure 5. The transcriptional response of breast cancer cell lines to glutamine deprivation.
(A) The heatmap representing the transcriptional response of MCF7 (luminal) and MDAMB231 (basal) cells to glutamine deprivation. (B, C). The predictive probability of the amino acid response (AAR) are shown for the luminal (B, p = 0.4, unpaired t-test) and basal (C, p = 0.0016) cancer cell lines grown under normal (4 mM, Q4) and glutamine-deficient (0 mM, Q0) medium. (D, E) The expression of selected canonical amino acid response genes including XBP1 (D) and DDIT3 (E) in MCF7 and MDAMB231 under indicated concentrations of glutamine with real time RT-PCR.

