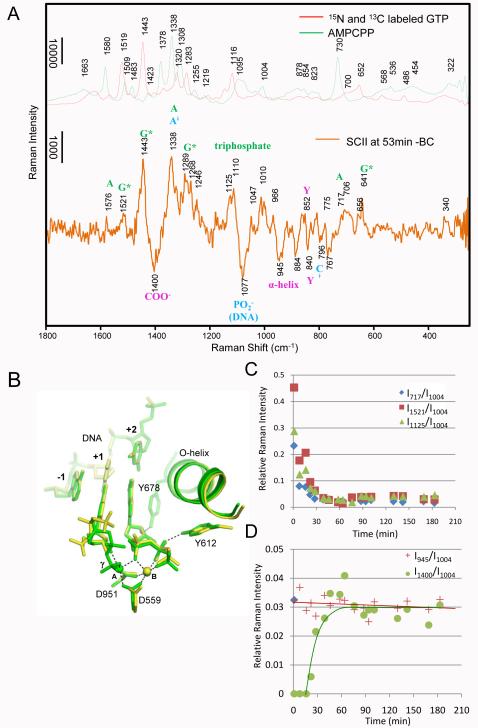
Fig. 4.
The changes from BC to SCII with SCII and SCI structure overlay. A) Comparing the spectra of 15N and 13C labeled GTP (red line) and unlabeled AMPCPP (green line) with Raman difference spectrum of SCII at 53 min - BC (orange line). The Raman features from bound labeled GTP (*G) and unlabeled AMPCPP (A) are marked green; features due to DNA perturbations are marked in blue, and features due to changes in the enzyme are marked in magenta. B) Superposition of the active site structures of SCI (yellow) and SCII (green). C) Substrate population change in the crystal over time from BC (time = 0) to SCII. Relative intensities at 717 (blue diamonds), 1125 (green triangles) and 1521 (red squares) cm−1 in SCII at x min – BC are plotted as a function of time. The Phe intensity at 1004 cm−1 in spectrum SCII at x min is used as internal standard. Peaks at 717, 1125 and 1521 cm−1 are due to bound A breathing mode, triphosphate mode of *GTP, and *G ring mode, respectively, as shown in Fig 4A. D) Changes of O-helix and metal-carboxylate coordination over time from BC to SCII. Relative intensities at 945 cm−1 due to α-helix change (red crosses, corresponding to O-helix rotation), and 1400 cm−1 due to metal-carboxylate coordination (green circles, corresponding to metal ions coordinating with D559 and D951) in spectra SCII at x min – BC are plotted as a function of time. The Phe intensity at 1004 cm−1 in SCII at x min is used as internal standard.

