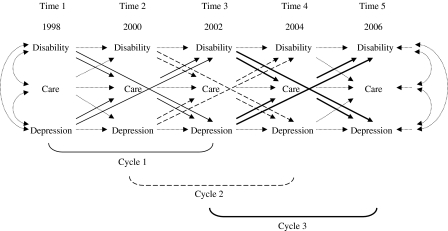
Figure 1.
Associations among disability, depressive symptoms, and informal care. Note. To simplify the presentation, concurrent associations in 2000, 2002, and 2004, higher order autoregressive effects, and control variables are not shown. The five time points can be divided into three cycles: Time 1-2-3 (Cycle 1, solid lines), Time 2-3-4 (Cycle 2, dashed lines), and Time 3-4-5 (Cycle 3, bolded lines). Dotted lines are used to indicate concurrent associations in 1998 and 2006, autoregressive effects, and the cross-lagged effects that are estimated in the model but not shown as part of the three cycles in Figure 2.

