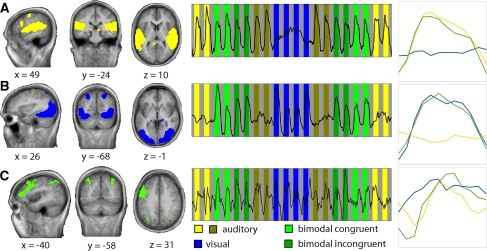
Fig. 3.
Independent component IC clusters of interest. Three IC cluster maps with activations in predominantly auditory (a), visual (b), and heteromodal (c) cortices are shown with their respective averaged time courses. Data are projected on group-averaged anatomical images according to neurological convention, with Talairach coordinates (x, y, and z) for the main cluster in view. Left hemisphere depicted on the left of image. Graphs in the middle show the respective component time courses against the background of the experimental conditions. Graphs on the right show the time courses averaged over blocks of the same condition (twelve time points, starting from the start of the block)

