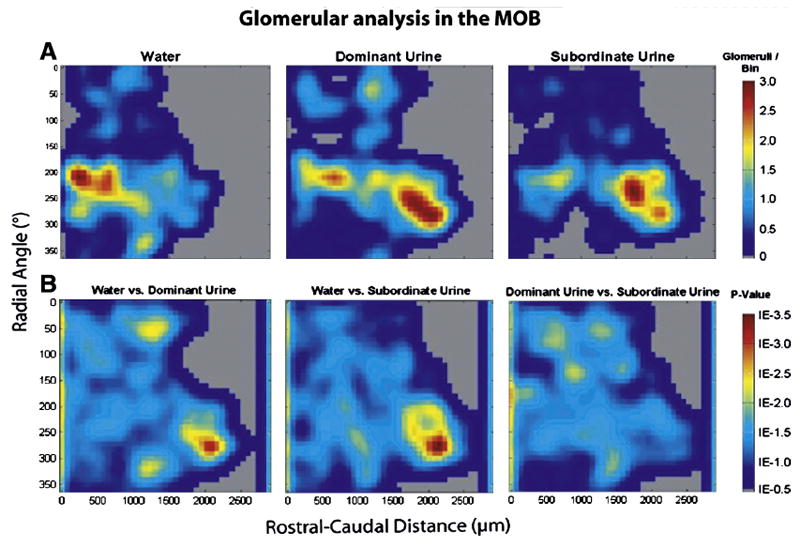
Figure 4.

A: contour plots showing areas of main olfactory bulb (MOB) glomerular activation in females exposed to water (clean; n=4), dominant male urine (n=5), or subordinate male urine (n=4) The scale showing the number of activated glomeruli per bin, 10° radial angle is located to the right of each panel; B: Mann-Whitney U comparisons between clean vs dominant, clean vs subordinate, and dominant vs subordinate male urine. Significant p-values were determined using a false discovery rate (FDR) critical value of 0.025 (1E -1.6)
