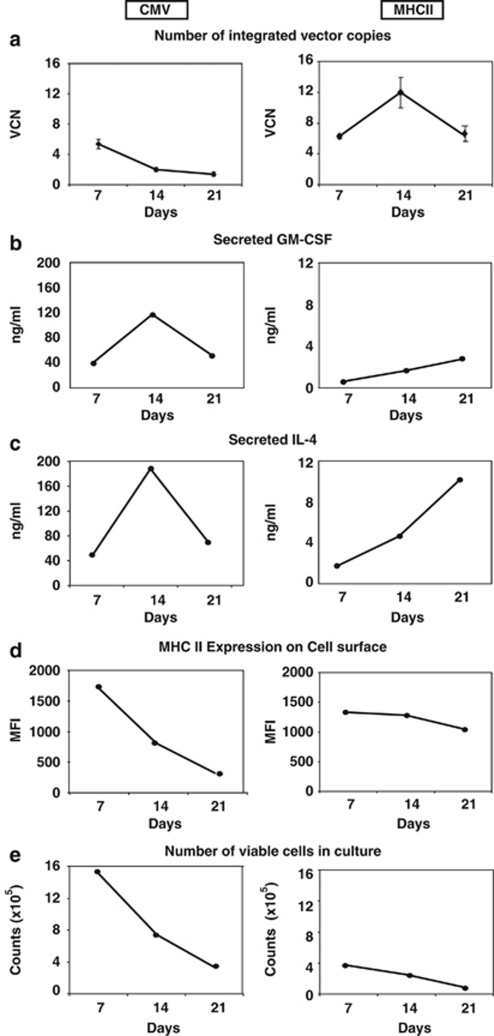
Figure 3.
Kinetics of CMV-SMART-DC versus MHCII-SMART-DC cell cultures: (a) vector copy number (VCN) of SMART-DCs quantified by RT-Q-PCR, representing copies per cell genome. Average calculated from triplicate RT-Q-PCR reactions performed with samples of two independent experiments, error bars represent mean+s.d. (b) Accumulated level of secreted GM-CSF in SMART-DCs supernatants determined by enzyme-linked immunosorbent assay (ELISA). (c) Accumulated level of secreted IL-4 in SMART-DCs supernatants determined by ELISA. (d) Mean fluorescent intensity (MFI) detected by flow cytometry of MHCII expression on CD11c+ DCs. (e) Total number of viable cell counts (counts) obtained by trypan blue exclusion staining of SMART-DC cultures. Average calculated from two independent experiments is shown.

