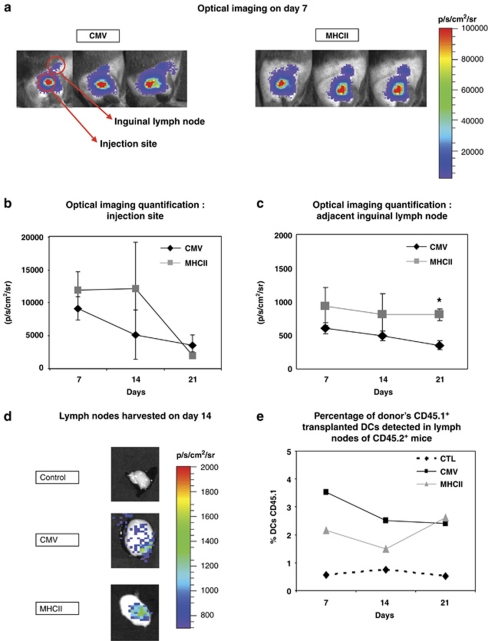
Figure 4.
DC migration analyses: (a) optical imaging analyses of sites injected with SMART-DC/fLUC on day 7. Note signal branching out toward the region of the adjacent inguinal lymph node. (b) Quantified values of bioluminescence signal expressed as photon per sec per cm2 per steridian (p/s/cm2/sr) detected on the region of injection at different time points (n=3). (c) Quantified values of bioluminescence signal on the region corresponding to the location of the adjacent inguinal lymph node at different time points. (d) Optical imaging analyses of collected inguinal lymph nodes (LN) located adjacent to the injection site. Note enlarged LNs showing detectable bioluminescent signal in mice injected with CMV-SMART-DC/fLUC or MHCII-SMART-DC/fLUC. (e) Frequency of CD11c+/MHCII+ DCs of donor origin (CD45.1+) detectable in lymph nodes of CD45.2+ vaccinated mice. Error bars represent mean+s.e.m. (N=3 for CMV/MHCII-SMART-DC, N=2 for control CTL). P-values were calculated by paired two-tailed Student's t-test *P<0.05.

