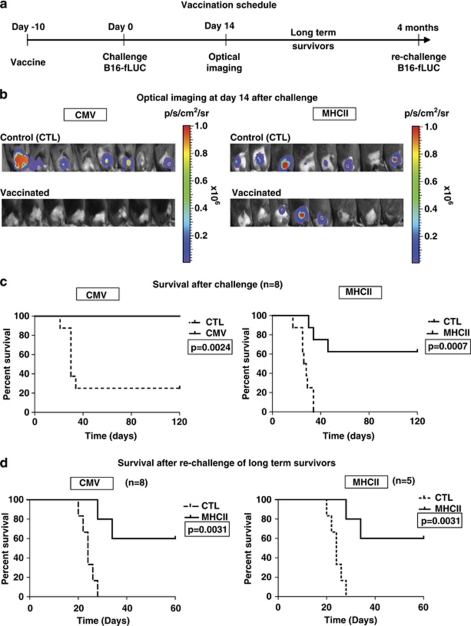
Figure 7.
Protective vaccinations with CMV-SMART-DCs versus MHCII-SMART-DCs followed by melanoma challenge: (a) Schedule of vaccination and challenge. A single vaccination of 1 × 10⁵ SMART-DCs co-transduced with LV-CMV or LV-MHCII (2 μg ml−1 p24 equivalent) plus LV-TRP2 (2 μg ml−1 p24 equivalent) was performed on day −10 and a lethal challenge with 5 × 10⁴ B16-fLUC was performed on day 0. On day 14, tumor growth was monitored by optical imaging analyses. Long-term survival of tumor-free mice was followed for 4 months (120 days). Long-term survivors were then rechallenged with 5 × 10⁴ B16-fLUC cells. (b) Optical imaging analyses of tumors on day 14 for the PBS ‘control' (CTL) and the SMART-DC vaccinated groups. (c) Kaplan–Meier survival curve after first challenge (N=8). (d) Kaplan–Meier survival curve after re-challenge of long-term survivors. (N=8 for CMV-SMART-DC; N=5 for MHCII SMART-DC). P-values were calculated by log-rank Mantel–Cox test.

