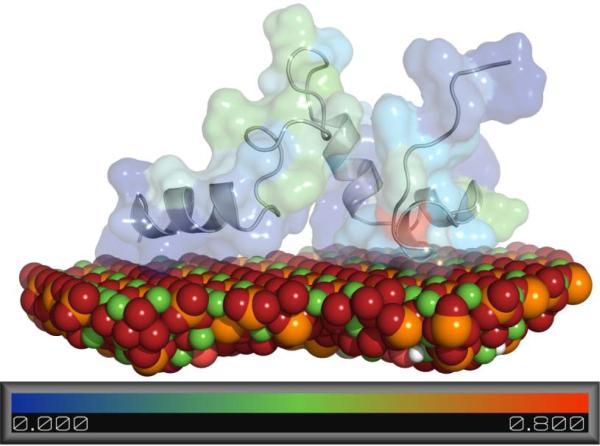
Figure 10. Local RMSD of a representative structure (Figure 9) relative to the 100 structures with lowest constraint energy.
To show the dispersion among structures, we superimposed the Cα atoms of every overlapping 3mer in the representative structure and each of the 100 structures with lowest Econstraint, and calculated the RMSD of the central Cα atom in the 3mer. The color bar is in angstroms and corresponds to the opaque profile defining LRAP's shape. LRAP pictured from C-terminus (left) to N-terminus (right).

