
Figure 6.
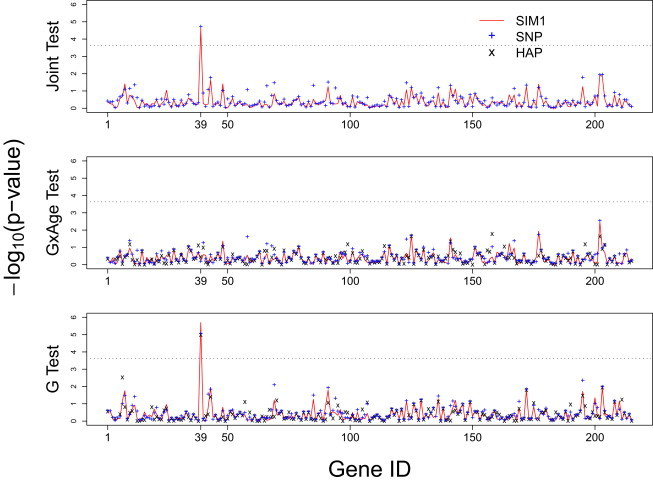
p Values with Negative Log 10 Transformation for the VISP Trial Analysis
The x axis shows the gene IDs sorted by the alphabetic order of the gene names, and gene ID 39 is CBS. The red line indicates results for SIM1, + for SNP method, and × for HAP method. The results for the SNP methods are based on the adjusted minimum p values that adjust for the multiple SNPs in a gene. The adjusted minimum p value is obtained by , where keff is the effective number of independent tests estimated with the method of Moskvina and Schmidt45 after accounting the LD among SNPs in a gene. A few genes are not plotted on the graph for the HAP methods because of convergence failure at these locations. This failure is mostly attributed to excessive number of SNPs in the gene.