
Figure 1.
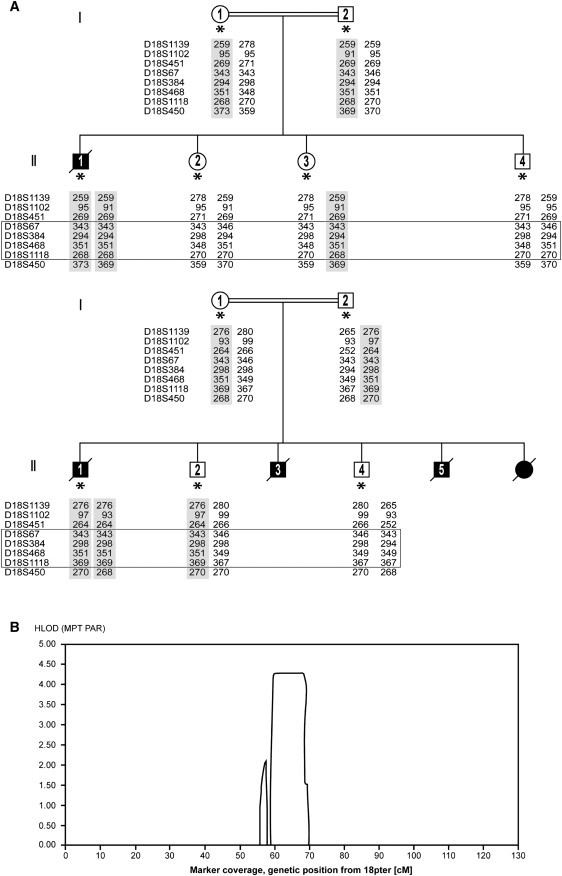
Family Pedigrees and Linkage Data
(A) Simplified genealogical trees of two unrelated families with MSG, epilepsy, and PND. Filled symbols represent affected patients. A double line represents consanguinity. An asterisk represents subjects analyzed by SNP arrays and included in the linkage analysis. The results of microsatellite marker analysis confirming homozygosity are also shown. The shaded areas represent the alleles containing the mutation, and the box represents the area found by linkage analysis.
(B) Output from easyLINKAGE showing an HLOD score of 4.3 for the region on chromosome 18q.