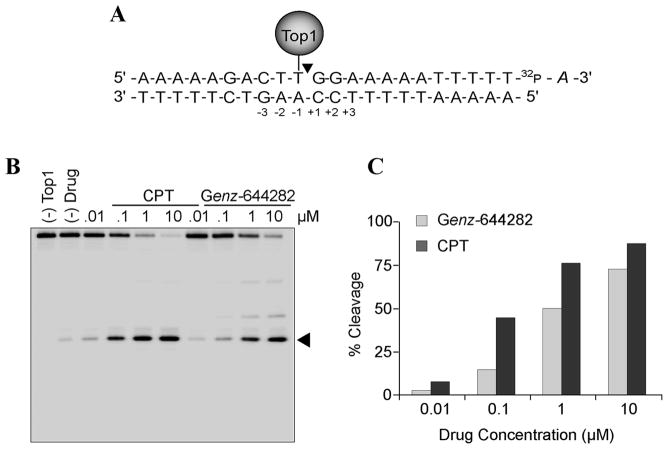
Figure 2. Top 1-cleavage complex induction by Genz-644282.
A) Schematic representation of the oligonucleotide substrate containing a single Top1-mediated cleavage site. The positions relative to the Top1 cleavage site [between positions (−3) and (+3)] are indicated. B) Comparisons of Top1-mediated DNA cleavage induced by Genz-644282 and CPT with the oligonucleotide substrate shown in panel A. C) Quantitative analysis of cleavage complexes induced by CPT or Genz-644282 are plotted as a function of compound concentrations.

