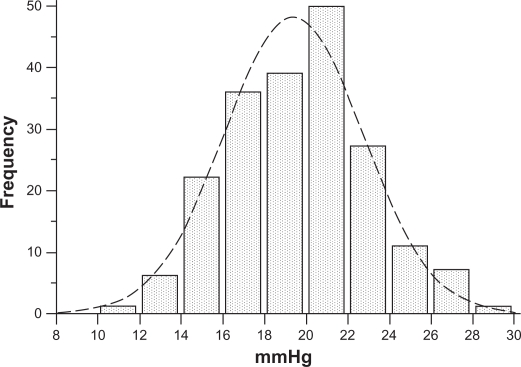
Figure 2.
IOP normal distribution according to DCT measurements in 200 nonglaucomatous eyes. Compared with the GAT IOP curve in Figure 1, a shift of the entire DCT IOP distribution curve to the right is observed. Ninety-four (47%) eyes had an IOP > 21 mmHg.
Abbreviations: DCT, dynamic contour tonometry; GAT, Goldmann applanation tonometry; IOP, intraocular pressure.

