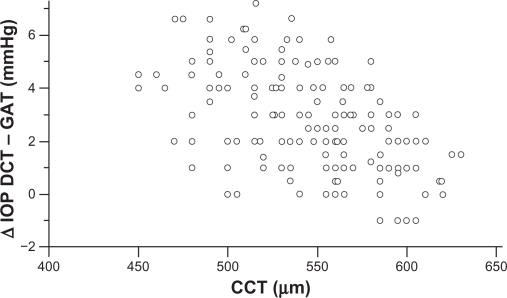
Figure 3.
CCT measurements plotted against the difference between DCT and GAT IOP measurements show a strongly negative correlation (Pearson’s correlation coefficient r = −0.517, P < 0.0001). IOP differences tend to increase in eyes with thinner corneas and to decrease in eyes with thicker corneas.
Abbreviations: CCT, central corneal thickness; DCT, dynamic contour tonometry; GAT, Goldmann applanation tonometry; IOP, intraocular pressure.

