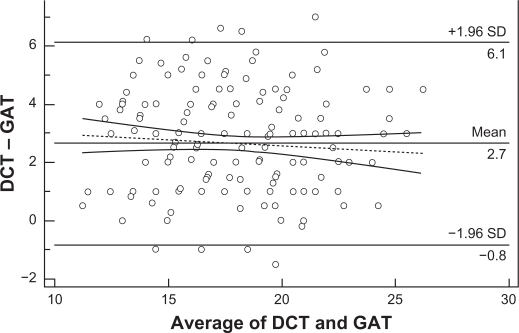
Figure 6.
Bland–Altman plot testing the clinical agreement of the IOP measurements obtained by DCT and GAT. The results of the 2 methods are clinically different, since the measurements are on average >2.7 mmHg apart. Therefore, the 2 methods are not interchangeable. The tendency of the IOP differences to decrease at higher IOPs was not statistically significant (dotted line, r = −0.083, P = 0.242).
Abbreviations: DCT, dynamic contour tonometry; GAT, Goldmann applanation tonometry; IOP, intraocular pressure; SD, standard deviation.

