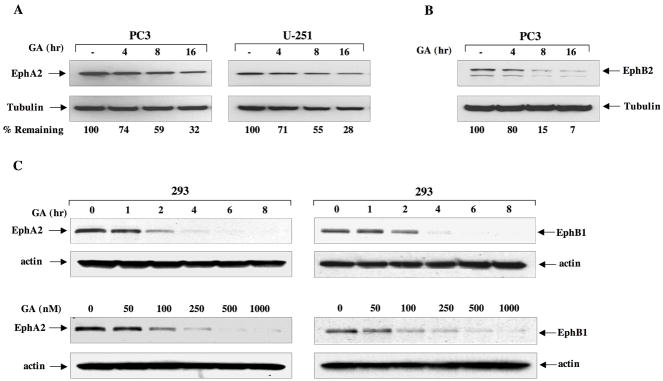
Fig 1. Eph proteins are sensitive to Hsp90 inhibition.
(A) PC3 and U251 cells were seeded in 6 well plates and treated with 1 μM GA for the indicated times. Cells were then lysed and equivalent protein subjected to SDS-PAGE and immunoblot analysis with EphA2 antibody. Tubulin was used as control for protein loading. (B) PC3 cells were treated with 1 μM GA, lysed as in A, and blots were probed for EphB2. (C) HEK293 cells were transfected with plasmids encoding either HA-tagged EphA2 or EphB1. Cells were treated with 1 uM GA for the indicated times and drug concentrations and lysates were probed with anti-HA antibody. For the dose response, cells were treated for 16 h. Band intensities were quantitated with NIH Image J software and normalized to tubulin levels. The receptor levels from untreated cells were considered 100% and the percentage of remaining receptor from drug treated cells was determined relative to the control expression.

