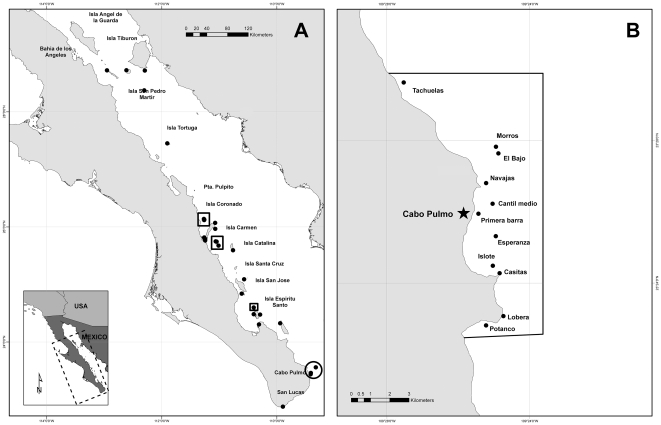
Figure 1. Location of sampling sites.
A) Sites surveyed by Sala et al. in 1999 [35], and resurveyed here in 2009. Dots inside the circle represent sites surveyed in Cabo Pulmo National Park in 1999. Dots inside squares represent sites in core zones (no-take areas) of other marine protected areas; the rest represent open access sites. B) Map of 11 sites surveyed at Cabo Pulmo National Park in 2009.

