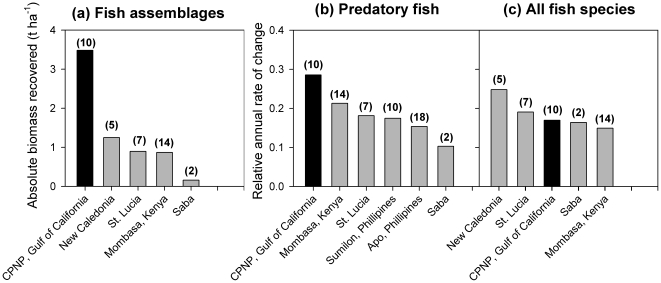
Figure 3. Comparison of the magnitude and rate of change of fish biomass at Cabo Pulmo National Park relative to other marine reserves around the world.
Data from other reserves were restricted to the few studies on temporal changes of total fish biomass (including all species) inside the same reserve. In all panels numbers in parentheses above bars represent years between surveys. In panels (b) and (c), relative annual rate of change between time zero and time t is calculated as: ρ = ln(xt/x 0)/t. Data sources: Mombasa [6], New Caledonia [7], Saba [43], St. Lucia [45], Sumilon and Apo [44].

