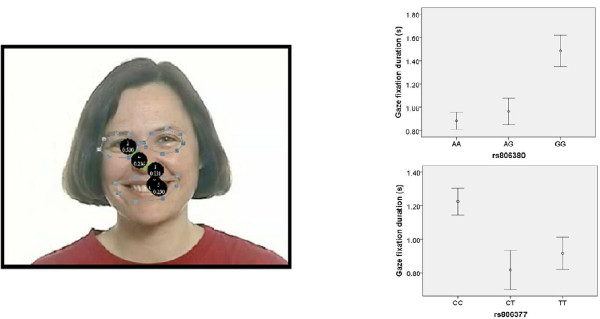
Figure 2.
Example gaze trail from a single participant and group mean gaze durations for happy faces classified by genotype. (a) Example gaze trail from a single participant on a still frame from a video stimulus showing a happy expression. The black circles represent fixation points and the amount of time (in seconds) spent in each. The dotted lines demarcate each look zone (eyes region and mouth region). (b) Gaze duration for happy faces grouped by genotype for rs806380 (top) and rs806377 (bottom), respectively. Unfilled circles indicate mean gaze duration, and error bars represent ± 1 SEM. From the Mindreading™ set developed by Baron-Cohen et al. [34]

