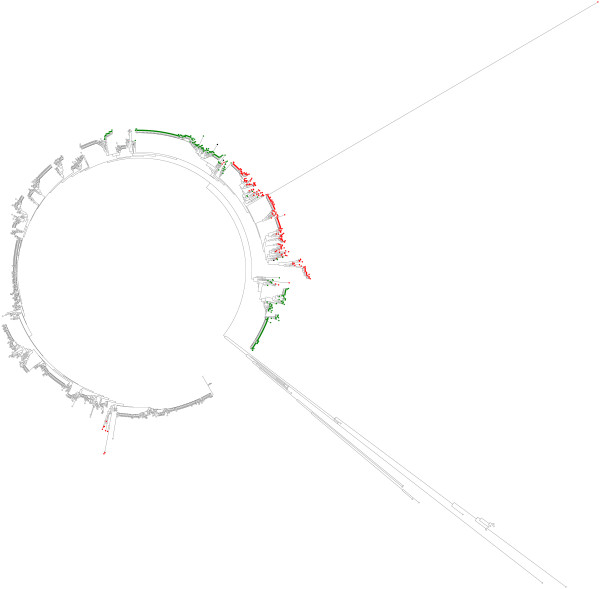
Figure 1.
Example of a semi-supervised classification of query STs from S. aureus database in the second experiment based on an annotated NJ tree. The STs marked with red and green colors represent the query STs labeled as the two new detected groups and the uncolored STs represent the remaining training data groups.

