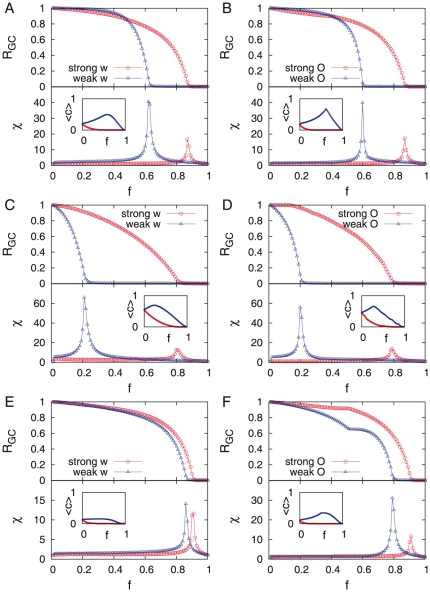
Figure 5. Link percolation analysis.
A, B. TI-OR model. C, D. TI-AND model. E, F. PE model. As the link strength, we use the weight (left panel) and the overlap (right panel). For each panel, we calculate the fraction of giant component  , susceptibility
  , and clustering coefficient
  (inset) as a function of the fraction of removed links,
  . Results are averaged over
  realizations for networks originally with
  for each model.

