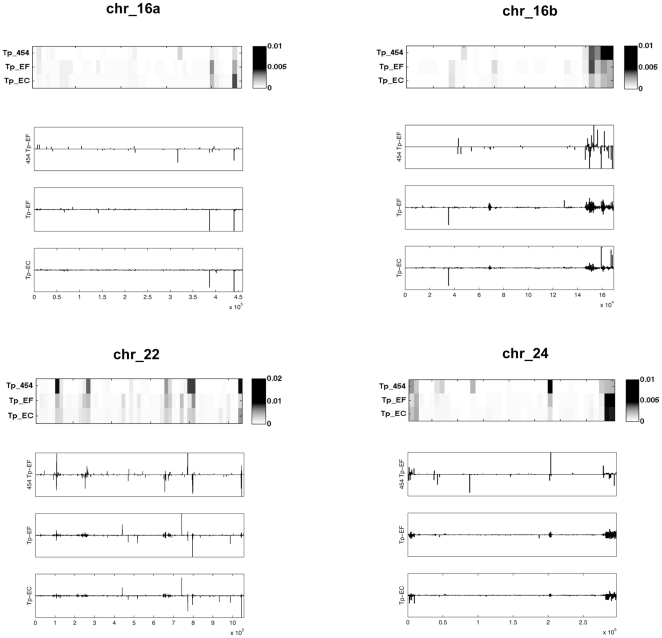
Figure 2. Heatmaps and histograms of small RNA candidate abundance mapped along chromosomes 16a, 16b, 22, 24.
All alignments to the T. pseudonana genome were binned, normalized, and then plotted along the length of the chromosome as a heatmap and as a histogram. The intensity of the spot on a heatmap denotes the abundance of sequences generated at the particular site relative to the total dataset for that sample, with darker colors depicting higher abundance. Additionally, the alignment coordinates of the sequences were binned into histograms along each chromosome. Values above the x-axis signify that the small RNA was transcribed along the plus strand of DNA, and below the x-axis for the minus strand. Each row of the heatmap represents a different sample library in the following order: Tp_454data, Tp_EF, Tp_EC. Bars above the line represent the plus strand and bars below the line represent the complimentary strand. A binsize of 10000 was used for both types of plots.

