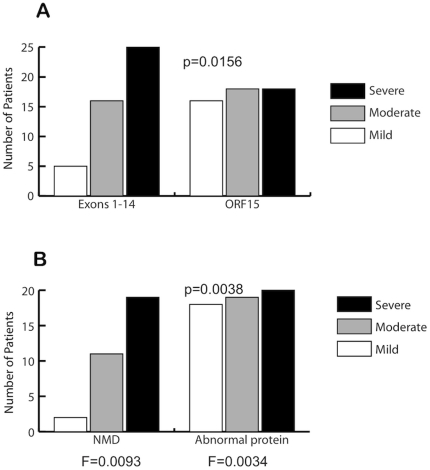
Figure 4. Allelic heterogeneity is associated with differences in clinical severity.
The charts depict the distribution of clinical severity for (A) mutations in exons 1–14 vs. mutations in ORF15 and (B) mutations that are predicted to result in nonsense-mediated decay (NMD) vs. mutations that are predicted to result in a translated, abnormal protein product. Mild = grade 1; Moderate = grade 2; Severe = grade 3. P-values were calculated using a two-tailed Fisher Exact Test comparing grade 1 and grade 3 patients in each group (grade 2 patients were excluded). F is the average coefficient of inbreeding.

