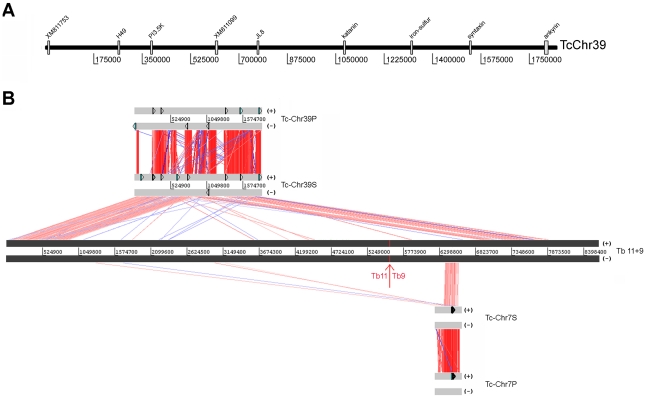
Figure 5. Alignment among homologous genomic regions of T. cruzi in silico assembled chromosomes TcChr39 and TcChr7, and T. brucei chromosomes Tb11 and Tb9.
Panel A) Schematic representation of chromosome-specific markers from the chromosomal band XVI (clone CL Brener) in the assembly sequence of chromosome TcChr39 (clone CL Brener). These markers were used as probes in chromoblot hybridizations. Panel B) Comparison among TcChr39 (“P” chromosome assigned to the non-Esmeraldo haplotype and “S” to the Esmeraldo haplotype) and TcChr7 (“P” and “S”) with chromosomes Tb11 and Tb9 of T. brucei. For ease of viewing, chromosomes Tb11 and Tb9 were joined together and drawn in the same line. The limit between Tb11 and Tb9 is shown by a red arrow. Grey blocks represent each chromosome. Homologous genes are connected by colored lines. . The matches and reverse matches are represented in red and in blue, respectively. The beginning of TcChr39 (821 kb) was aligned to the initial portion of Tb11. The end of the TcChr39 (1 Mb) shows similarity with Tb9 end (positions 1.8 Mb to 2.8 Mb). TcChr7 constituted the beginning of Tb9 (390 kb region between positions 1.1-1.5 Mb). Chromosome-specific markers are drawn in sense (+) and antisense (-) strands.

