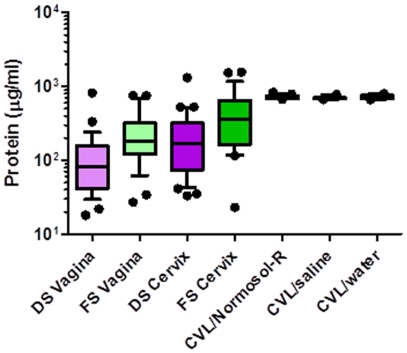
Figure 2. Protein levels in female genital tract secretions collected by swabs and cervicovaginal lavages (CVL).
Female genital tract secretions were collected by Dacron swabs (DS) and flocked swabs (FS) from the vagina and the endocervix (cervix) and by CVL using Normosol-R, saline, or water. Protein levels were determined using the Bradford assay. Data are presented as box and whisker plots where the median is the horizontal line through the vertical box which represents the 25–75th percentiles. Values within the 10–90th percentiles are represented by the error bars. Outliers are shown by filled circles. Data were log-transformed and significant changes were determined using linear mixed model and discussed in the results section.

